interval_distribution
|
```
import pandas as pd
from tpf.mlib import ModelEval as me
y_prob_file = "/ai/data/tmp/y_prob.csv"
df = pd.read_csv(y_prob_file)
df
```
```
y_probs = df["y_prob"].to_numpy()
y_label = df["y_label"].to_numpy()
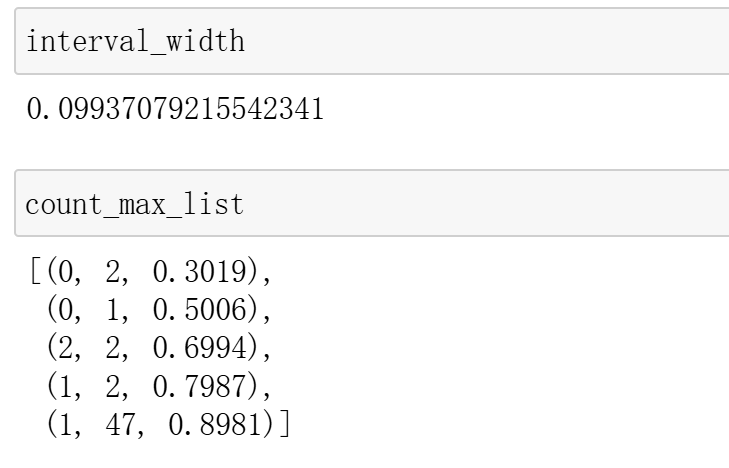
count_max_list, interval_width =me.interval_distribution(y_probs,y_label,interval=10,)
```
|
|
```
@staticmethod
def interval_distribution(y_probs, y_test, interval=100):
"""计算y_test在y_probs区间内的分布,按区间最小值升序排列
params
-------------------------------------------------------
- y_probs: 模型概率输出,1维数组,每个元素为正样本概率
- y_test: 真实标签,1维数组,二分类标签(0或1)
- interval: 区间数量,默认为100,即将概率范围划分为100个等宽区间
return
-------------------------
- count_max_list: 三元组列表,每个元素格式为 (zero_count, positive_count, interval_min)
- zero_count: 该区间内标签为0的样本数量
- positive_count: 该区间内标签为1的样本数量
- interval_min: 该区间的最小概率值
- 列表按interval_min升序排列,仅包含有正样本的区间
- interval_width: 每个区间的宽度值,计算方式为 (max_val - min_val) / interval
实际逻辑说明:
1. 将y_probs的取值范围[min_val, max_val]等分为interval个区间
2. 统计每个区间内y_test中标签为1和标签为0的样本数量
3. 只返回有正样本(count > 0)的区间信息
4. 按区间最小值(interval_min)升序排列结果
examples
--------------------------------------------------------
count_max_list, interval_width = ModelEval.interval_distribution(y_probs, y_test)
# count_max_list: [(zero_count1, positive_count1, interval_min1),
# (zero_count2, positive_count2, interval_min2), ...]
# interval_width: 浮点数,表示每个区间的宽度
for zero_count, positive_count, interval_min in count_max_list:
print(f"区间[{interval_min:.3f}, {interval_min+interval_width:.3f}): "
f"正样本{positive_count}个, 负样本{zero_count}个")
"""
if y_probs.ndim != 1:
raise Exception(f"y_probs必须为1维,实际为{y_probs.ndim}维")
min_val = np.min(y_probs)
max_val = np.max(y_probs)
interval_width = (max_val - min_val) / interval
result = []
for i in range(interval):
interval_min = min_val + i * interval_width
interval_max = min_val + (i + 1) * interval_width
# 找到该区间对应的y_probs的索引
interval_indices = np.where((y_probs >= interval_min) & (y_probs < interval_max))[0]
# 统计相同索引位置上y_test中为1的个数
count = np.sum(y_test[interval_indices] == 1)
result.append((round(float(interval_min),4), round(float(interval_max),4), int(count)))
count_max_list = sorted([(np.sum(y_test[interval_indices] == 0), count, interval_min)
for interval_min, interval_max, count in result
if count > 0
for interval_indices in [np.where((y_probs >= interval_min) & (y_probs < interval_max))[0]]],
key=lambda x: x[2])
count_max_list = [(int(zero_count), int(count), round(float(interval_min), 4))
for zero_count, count, interval_min in count_max_list]
return count_max_list, interval_width
```
|
|
|
|
|
|
|
eval_num_interval
|
```
@staticmethod
def eval_num_interval(y_probs, y_test, interval=10):
"""
按y_probs值从高到低取固定个数进行统计分析
与eval_prob_interval方法不同,此方法按y_probs中值从高到低取个数分组,
比如y_probs中值最大为0.7,从0.7开始往下数interval个样本,然后统计对应
y_test中标签为1的个数
参数:
- y_probs: 模型概率输出,1维数组,每个元素为正样本概率
- y_test: 真实标签,1维数组
- yuzhi: 阈值(此方法中不使用,保留参数一致性)
- interval: 每组样本数量,默认为10
返回:
- 四元组列表 [(min_prob, max_prob, count_ones, cumulative_count), ...]
- min_prob: 当前组的最小概率值
- max_prob: 当前组的最大概率值
- count_ones: 当前组中y_test标签为1的个数
- cumulative_count: 当前组的累积样本数(第1组为interval,第2组为2*interval,以此类推)
"""
# 输入验证
if y_probs.ndim != 1:
raise Exception(f"y_probs必须为1维,实际为{y_probs.ndim}维")
if y_test.ndim != 1:
raise Exception(f"y_test必须为1维,实际为{y_test.ndim}维")
if len(y_probs) != len(y_test):
raise Exception(f"y_probs和y_test长度必须相同,实际分别为{len(y_probs)}和{len(y_test)}")
if interval <= 0:
raise Exception(f"interval必须大于0,实际为{interval}")
# 获取原始索引,并按y_probs值降序排列
sorted_indices = np.argsort(y_probs)[::-1] # 降序排列的索引
sorted_y_probs = y_probs[sorted_indices] # 排序后的概率值
sorted_y_test = y_test[sorted_indices] # 对应的真实标签
total_samples = len(y_probs)
result = []
# 按interval大小分组处理
for start_idx in range(0, total_samples, interval):
end_idx = min(start_idx + interval, total_samples)
# 当前组的概率范围
current_probs = sorted_y_probs[start_idx:end_idx]
current_labels = sorted_y_test[start_idx:end_idx]
min_prob = float(np.min(current_probs))
max_prob = float(np.max(current_probs))
# 统计当前组中标签为1的个数
count_ones = int(np.sum(current_labels == 1))
# 累积样本数(当前组的结束位置)
cumulative_count = end_idx
result.append((min_prob, max_prob, count_ones, cumulative_count))
return result
```
|
|
|
|
|
|
|
|
|
eval_prob_interval
|
```
@staticmethod
def eval_prob_interval( y_probs, y_test, interval=0.01):
"""
1. y_probs中值大于yuzhi的预测结果为1 否则为0;但实际上y_probs的值是一个概率,
2. 现在对y_probs按interval划分区间,比如y_probs的最小值为min,最大值为max,在[min,min+0.1]的范围内,y_test中1的个数是多少,y_probs在[min+0.1,min+0.2]的概率区中,y_test中1的个数是多少,以此类推,直到y_probs的最小值和最大值之间的区间,返回一个列表,列表中每个元素为[min,min+interval]的概率区间中,y_test中1的个数是多少
3. 返回一个列表,列表中每个元素为[min,min+interval]的概率区间中,y_test中1的个数是多少
4. 首先划定y_probs的[min,min+interval]区间,然后求y_probs在这个区间中的索引index,然后统计y_test[index]中1的个数,通过index一一对应
4. 最后的结果是一个四元组列表,[(min, max, count_ones, count_total)],按count_ones降序排列
"""
# 输入验证
if y_probs.ndim != 1:
raise Exception(f"y_probs必须为1维,实际为{y_probs.ndim}维")
if y_test.ndim != 1:
raise Exception(f"y_test必须为1维,实际为{y_test.ndim}维")
if len(y_probs) != len(y_test):
raise Exception(f"y_probs和y_test长度必须相同,实际分别为{len(y_probs)}和{len(y_test)}")
if interval <= 0:
raise Exception(f"interval必须大于0,实际为{interval}")
# 获取y_probs的最小值和最大值
min_val = np.min(y_probs)
max_val = np.max(y_probs)
# 如果最大值等于最小值,返回单个区间
if max_val == min_val:
count_ones = np.sum(y_test == 1)
count_total = len(y_test)
return [(float(min_val), float(max_val), int(count_ones), int(count_total))]
# 计算区间数量,确保覆盖整个范围
num_intervals = int(np.ceil((max_val - min_val) / interval))
result = []
# 遍历每个区间
for i in range(num_intervals):
# 计算当前区间的最小值和最大值
interval_min = min_val + i * interval
interval_max = min_val + (i + 1) * interval
# 对于最后一个区间,确保包含最大值
if i == num_intervals - 1:
interval_max = max_val + 1e-10 # 添加一个小的epsilon以包含最大值
# 找到在当前区间内的y_probs的索引
interval_indices = np.where((y_probs >= interval_min) & (y_probs < interval_max))[0]
# 统计对应索引位置上y_test中为1的个数
count_ones = np.sum(y_test[interval_indices] == 1)
# 统计该区间内y_probs的总个数
count_total = len(interval_indices)
# 添加到结果列表中
result.append((float(interval_min), float(interval_max), int(count_ones), int(count_total)))
# 按count_ones降序排列
result.sort(key=lambda x: x[2], reverse=True)
return result
```
|
|
|
|
|
|
|
|
|