CogView-3-Flash
|
API示例
https://docs.bigmodel.cn/cn/api/introduction

```

curl --request POST \
  --url https://open.bigmodel.cn/api/paas/v4/images/generations \
  --header 'Authorization: Bearer 715c...tjc3' \
  --header 'Content-Type: application/json' \
  --data '
{
  "model": "cogView-4-250304",
  "prompt": "一只可爱的小猫咪,坐在阳光明媚的窗台上,背景是蓝天白云.",
  "size": "1024x1024"
}
'
```
- apikeys
- https://bigmodel.cn/usercenter/proj-mgmt/apikeys

|
- 提前制定模板
- 上传文件
- 生成海报
需求 - 公众号生成的大模型 - 先自己做一个简单的方案,出来一版 - 省分行的一个公众号 - 后期还可能有视频 - 文章中带一些视频 - 目的它们把材料给广告公司,广告公司整理出了海报 - 在外网环境部署,类似公众号生成的图文排版 - 主要是为了让别人用 - 上传文章,生成海报,如果能对接微信的公众号直接发布,就最好了 - 直接调用外网的免费API接口,用量不大, 加一个壳子 - 最初的版本可以不做这些历史记录,最开始把核心的文章 -- 海报的图片生成了 - 方案二,先生成html - 再将Html转化为图片 - 一个分行一个月发布一篇文章 - 参考公众号编辑的,外网阿里云服务一个服务器,使用开源API接口, - 行里申请一个API账户,用行里的账户 - 材料是脱敏过的,可以放外网 如果使用付费的也可以,因为量不大 千问 混元 flash |
|
|
|
|
|
|
doubao-seedream-4-5-251128
```
anlian_text = """
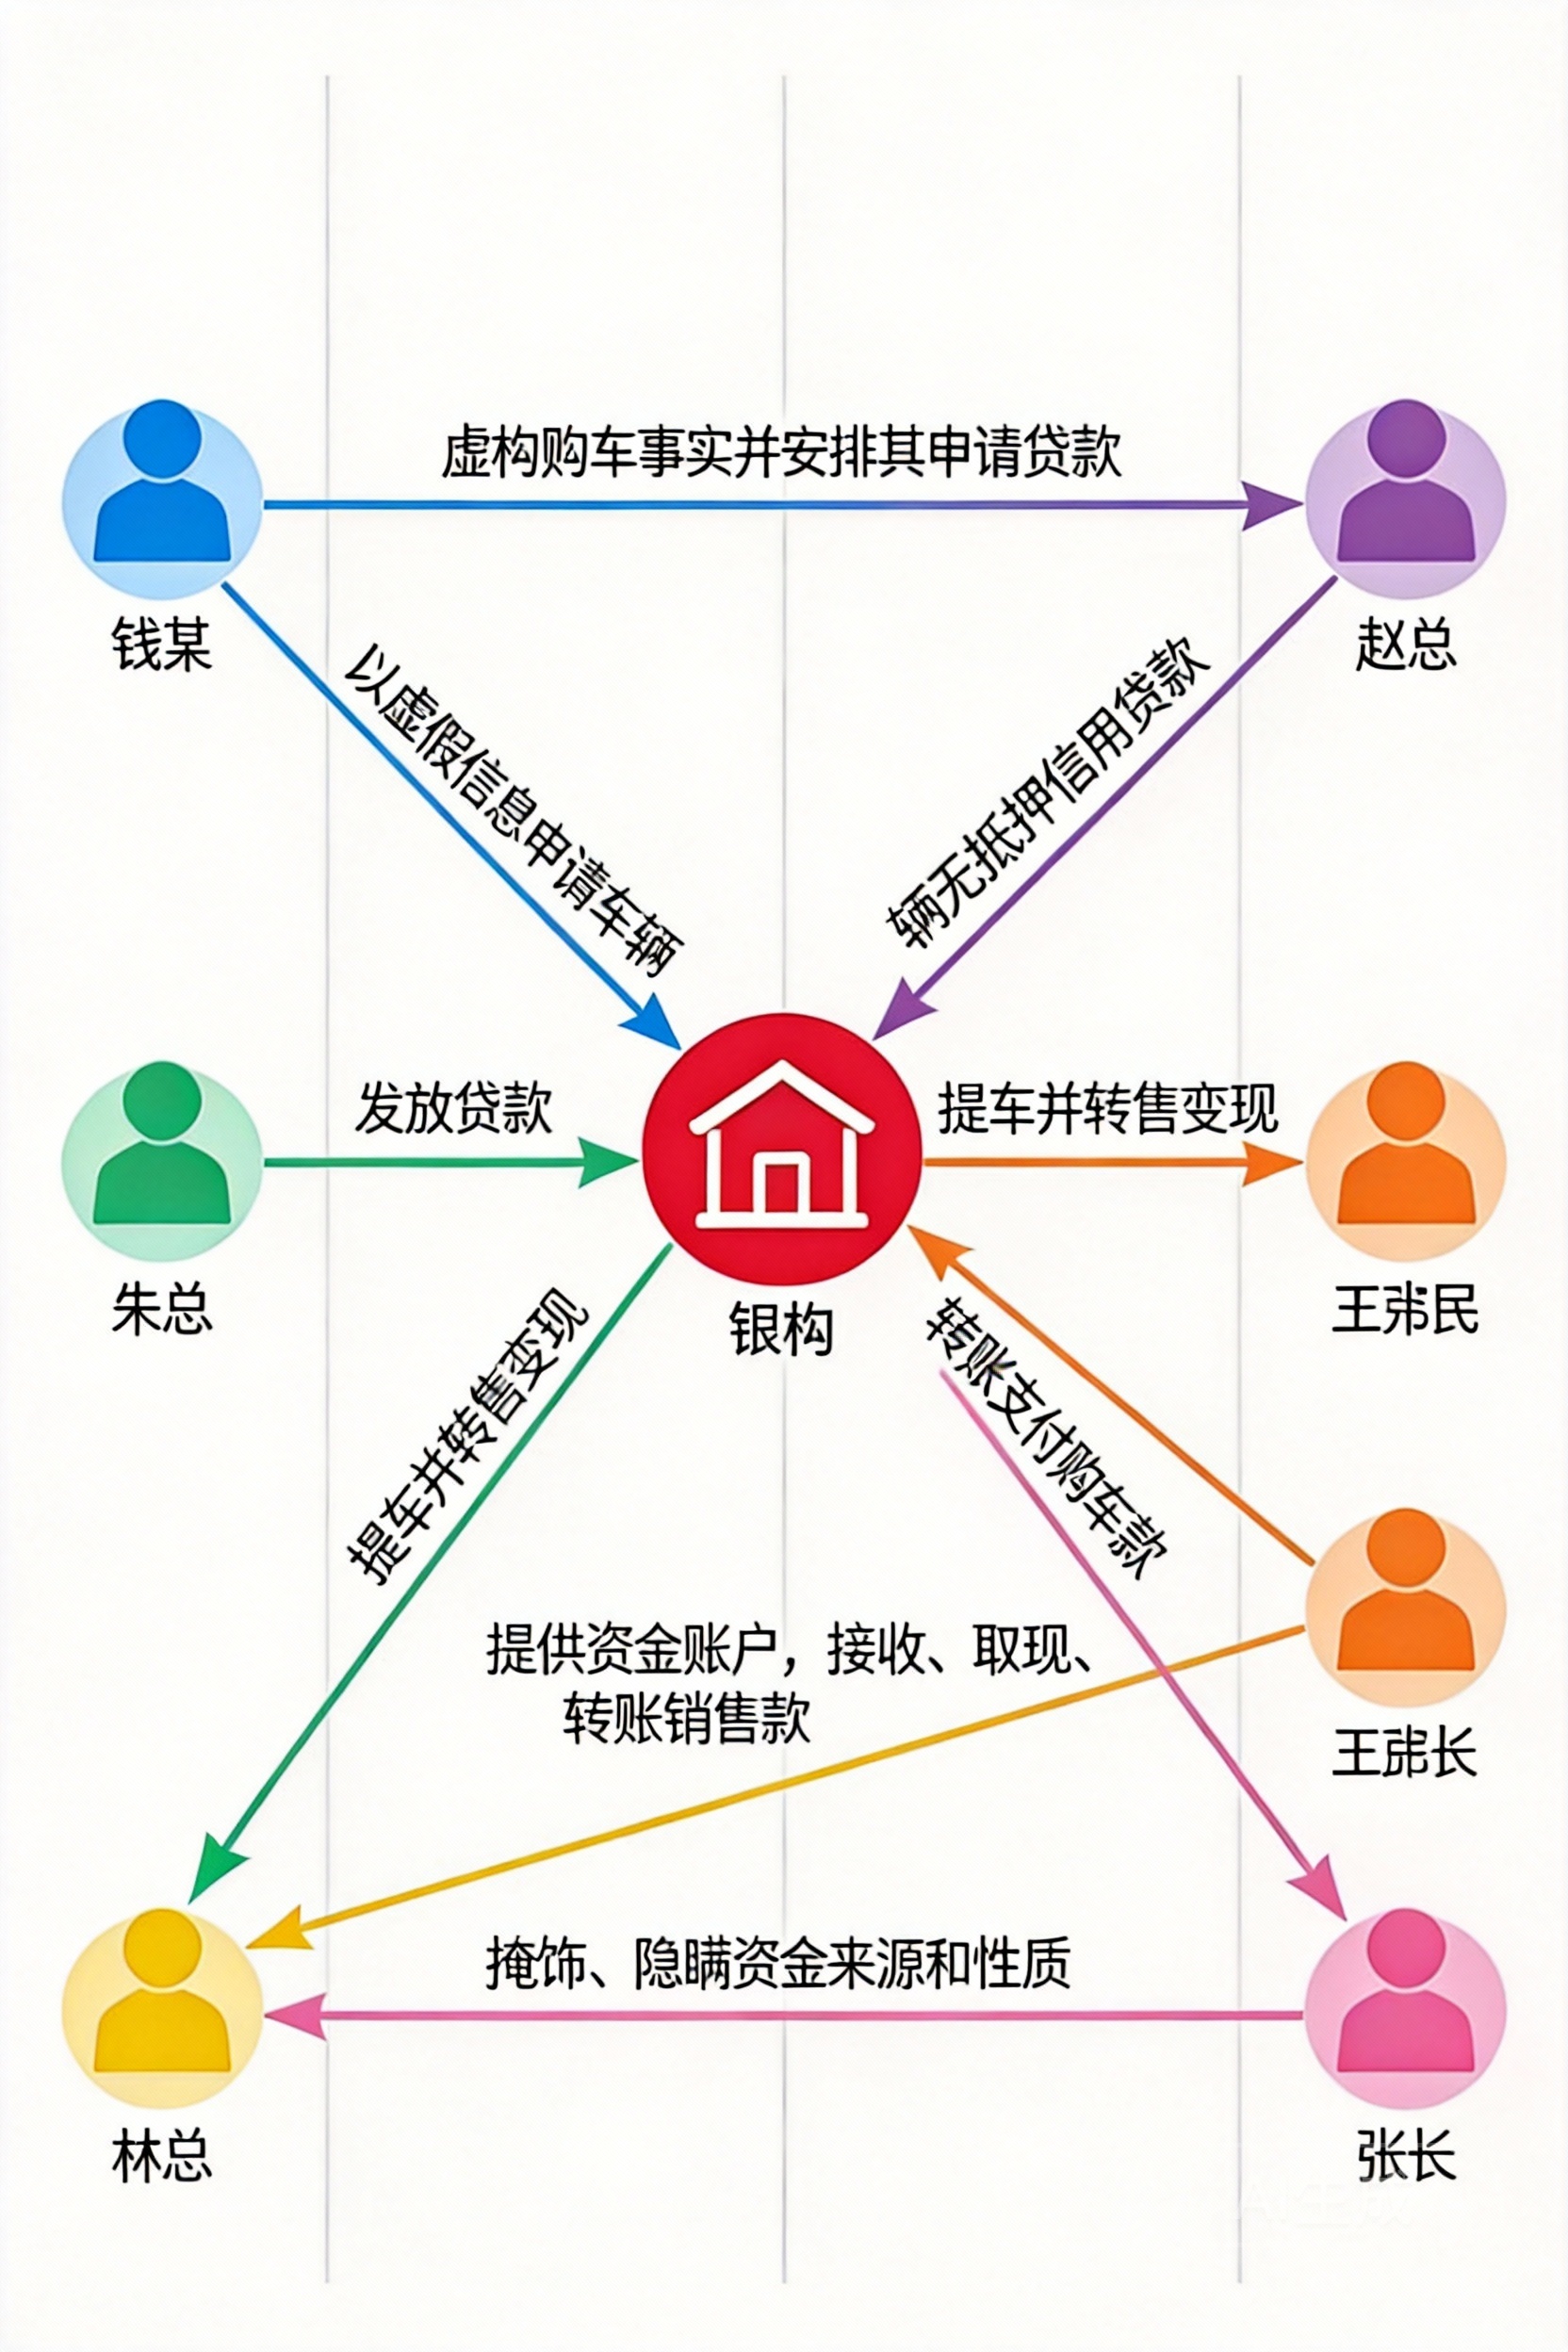
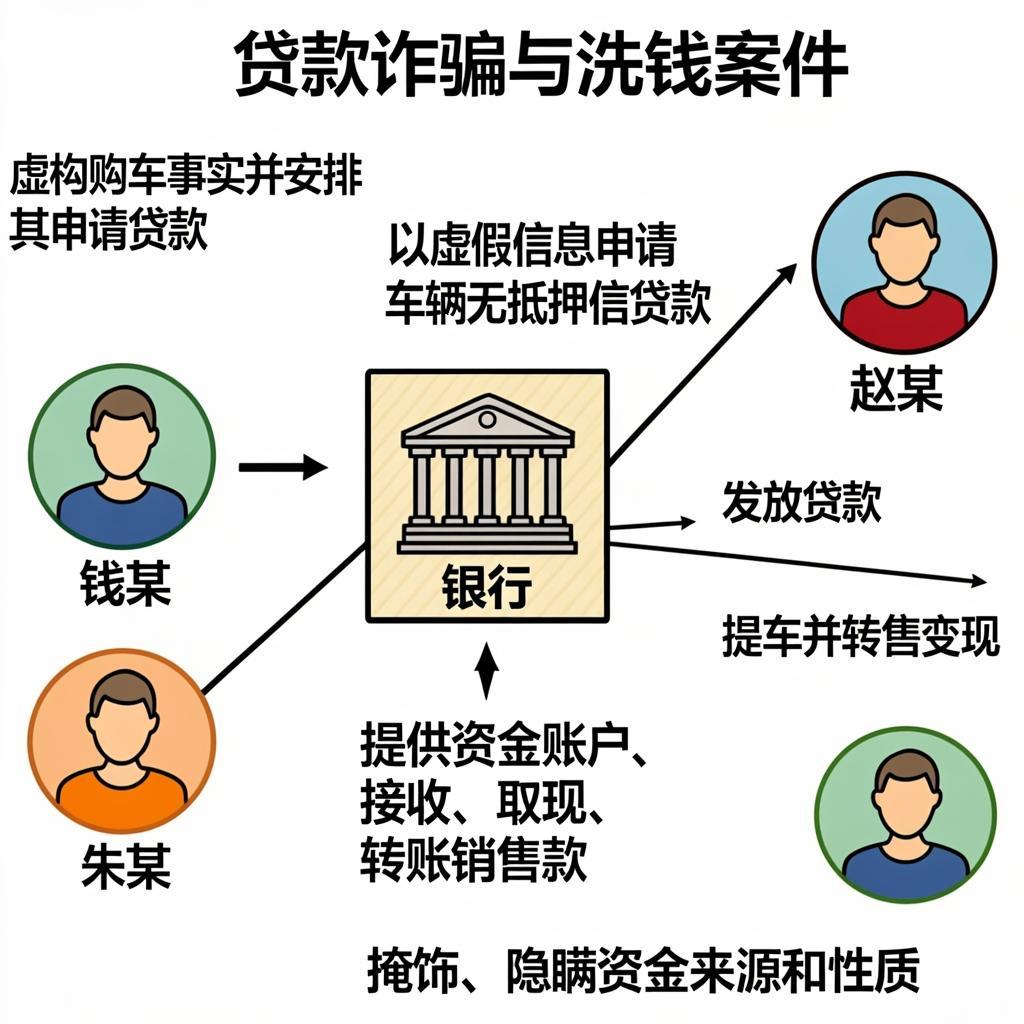
2023年7月至9月间,钱某与朱某等人结伙,以非法占有为目的,虚构林某等人购车的事实,
先支付首付款、购置税、保险等部分款项,
再安排林某等人以虚假信息向银行申请车辆无抵押信用贷款。
待银行贷款发放后,钱某、朱某等人立即提车、转售变现。
2023年8月至9月间,赵某明知钱某、朱某向其出售的汽车系贷款诈骗所得,
仍予以收购、转移、销售,后向钱某、朱某指定的银行账户转账支付购车款。
王某、张某明知钱某、朱某团伙汽车销售款系贷款诈骗所得,
仍为其提供资金账户,予以接收、取现、转账,掩饰、隐瞒资金来源和性质。
"""
prompt1 = """
你的任务是根据场景描述生成一张流程图图片的描述
1. 分析场景中的人物,机构,以及人与人,人与机构之间的行为
2. 以人或机构为节点,以行为为线,按事件的发展顺序生成流程图
3. 人物节点的图标中一个小人
4. 机构节点是一个房子或建筑图标
5. 节点与节点之间的线要有箭头指向,边要细一些
6. 线的中间要有行为描述,即表示这条线代表的行为内容
7. 注意线表示的行为,不是人物或机构,线上填充的文本为行为描述
现在要根据下面的场景生成一张流程图的描述
{anlian_text}
重点强调
1. 再次理解场景{anlian_text}中的人物,机构,事件行为,确保在描述节点时使用场景中本身的名称,为了与场景描述更接近,不要使用通用名称替换
2. 进一步梳理节点与节点之间的关系,使用三元组进行描述,(节点1,节点2,行为事件描述);多个元组形成一个列表输出
3. 不要遗漏节点或行为
"""
from tpf.llm import MyChat
chat = MyChat("/ai/wks/aitpf/src/tpf/llm/env.txt")
res = chat.deepseek(prompt1)
```
|
```
from tpf.llm import MyChat
chat = MyChat()

anlian_text = """
2023年7月至9月间,钱某与朱某等人结伙,以非法占有为目的,虚构林某等人购车的事实,
先支付首付款、购置税、保险等部分款项,
再安排林某等人以虚假信息向银行申请车辆无抵押信用贷款。
待银行贷款发放后,钱某、朱某等人立即提车、转售变现。
2023年8月至9月间,赵某明知钱某、朱某向其出售的汽车系贷款诈骗所得,
仍予以收购、转移、销售,后向钱某、朱某指定的银行账户转账支付购车款。
王某、张某明知钱某、朱某团伙汽车销售款系贷款诈骗所得,
仍为其提供资金账户,予以接收、取现、转账,掩饰、隐瞒资金来源和性质。
"""

lctu_yaosu = """
流程图描述如下:

1. **节点**(共7个):
   - **人物节点**(小人图标):钱某、朱某、林某、赵某、王某、张某。
   - **机构节点**(房子图标):银行。

2. **流程顺序与连线**(带箭头细线,线上标注行为描述):
   - 从 **钱某** 和 **朱某** 分别引出箭头指向 **林某**,线上标注:“虚构购车事实并安排其申请贷款”。
   - 从 **林某** 引出箭头指向 **银行**,线上标注:“以虚假信息申请车辆无抵押信用贷款”。
   - 从 **银行** 分别引出箭头指向 **钱某** 和 **朱某**,线上标注:“发放贷款”。
   - 从 **钱某** 和 **朱某** 分别引出箭头指向 **赵某**,线上标注:“提车并转售变现”。
   - 从 **赵某** 分别引出箭头指向 **钱某** 和 **朱某**,线上标注:“转账支付购车款”。
   - 从 **钱某** 和 **朱某** 分别引出箭头指向 **王某** 和 **张某**,线上标注:“提供资金账户,接收、取现、转账销售款”。
   - 从 **王某** 和 **张某** 分别引出箭头指向 **钱某** 和 **朱某**,线上标注:“掩饰、隐瞒资金来源和性质”。

3. **布局建议**:
   - 流程图按时间顺序从左到右排列,左侧为钱某、朱某、林某,中间为银行,右侧为赵某、王某、张某。
   - 连线清晰,箭头指向明确,行为描述简洁置于线上方或下方。

4. **备注**:所有节点使用场景中具体名称(钱某、朱某、林某、赵某、王某、张某、银行),行为描述基于原文提炼,确保信息完整。
"""


prompt = f"""
你的任务是根据场景描述生成一张流程图图片
1. 分析场景中的人物,机构,以及人与人,人与机构之间的行为
2. 以人或机构为节点,以行为为线,按事件的发展顺序生成流程图
3. 人物节点的图标中一个小人
4. 机构节点是一个房子或建筑图标
5. 节点与节点之间的线要有箭头指向,边要细一些
6. 线的中间要有行为描述,即表示这条线代表的行为内容
7. 流程图中不要出现“犯罪嫌疑人”这种通用的人物名称,请使用场景描述中的张某,林某替换
8. 节点与边使用彩色的线条,不要使用黑白色

现在要根据下面的场景生成一张流程图
{anlian_text}

流程图生成要素如下:
{lctu_yaosu}

重点强调
1. 再次理解场景{anlian_text}中的人物,机构,事件行为,确保在描述节点时使用场景中本身的名称,为了与场景描述更接近,不要使用通用名称替换
2. 不要遗漏节点或行为
3. 每一条边必须连接两个节点,每个节点必须有名称,并且这个名称来自于场景,不能自行命名
4. 最终生成的图片中不要有重复的节点,如果有,则将重复的节点合并为1个节点
5. 确定整理的流程后,合理排版,再生成图片

"""

url,img_path = chat.doubao_image(prompt=prompt, outdir="")

print("img_path:",img_path)

```
|
|
|
|
|
|
|
|
|
|
|
|
glm-image
```
from tpf.llm import MyChat
chat = MyChat()

anlian_text = """
2023年7月至9月间,钱某与朱某等人结伙,以非法占有为目的,虚构林某等人购车的事实,
先支付首付款、购置税、保险等部分款项,
再安排林某等人以虚假信息向银行申请车辆无抵押信用贷款。
待银行贷款发放后,钱某、朱某等人立即提车、转售变现。
2023年8月至9月间,赵某明知钱某、朱某向其出售的汽车系贷款诈骗所得,
仍予以收购、转移、销售,后向钱某、朱某指定的银行账户转账支付购车款。
王某、张某明知钱某、朱某团伙汽车销售款系贷款诈骗所得,
仍为其提供资金账户,予以接收、取现、转账,掩饰、隐瞒资金来源和性质。
"""

lctu_yaosu = """
流程图描述如下:

1. **节点**(共7个):
   - **人物节点**(小人图标):钱某、朱某、林某、赵某、王某、张某。
   - **机构节点**(房子图标):银行。

2. **流程顺序与连线**(带箭头细线,线上标注行为描述):
   - 从 **钱某** 和 **朱某** 分别引出箭头指向 **林某**,线上标注:“虚构购车事实并安排其申请贷款”。
   - 从 **林某** 引出箭头指向 **银行**,线上标注:“以虚假信息申请车辆无抵押信用贷款”。
   - 从 **银行** 分别引出箭头指向 **钱某** 和 **朱某**,线上标注:“发放贷款”。
   - 从 **钱某** 和 **朱某** 分别引出箭头指向 **赵某**,线上标注:“提车并转售变现”。
   - 从 **赵某** 分别引出箭头指向 **钱某** 和 **朱某**,线上标注:“转账支付购车款”。
   - 从 **钱某** 和 **朱某** 分别引出箭头指向 **王某** 和 **张某**,线上标注:“提供资金账户,接收、取现、转账销售款”。
   - 从 **王某** 和 **张某** 分别引出箭头指向 **钱某** 和 **朱某**,线上标注:“掩饰、隐瞒资金来源和性质”。

3. **布局建议**:
   - 流程图按时间顺序从左到右排列,左侧为钱某、朱某、林某,中间为银行,右侧为赵某、王某、张某。
   - 连线清晰,箭头指向明确,行为描述简洁置于线上方或下方。

4. **备注**:所有节点使用场景中具体名称(钱某、朱某、林某、赵某、王某、张某、银行),行为描述基于原文提炼,确保信息完整。
"""


prompt = f"""
你的任务是根据场景描述生成一张流程图图片
1. 分析场景中的人物,机构,以及人与人,人与机构之间的行为
2. 以人或机构为节点,以行为为线,按事件的发展顺序生成流程图
3. 人物节点的图标中一个小人
4. 机构节点是一个房子或建筑图标
5. 节点与节点之间的线要有箭头指向,边要细一些
6. 线的中间要有行为描述,即表示这条线代表的行为内容
7. 流程图中不要出现“犯罪嫌疑人”这种通用的人物名称,请使用场景描述中的张某,林某替换
8. 节点与边使用彩色的线条,不要使用黑白色

现在要根据下面的场景生成一张流程图
{anlian_text}

流程图生成要素如下:
{lctu_yaosu}

重点强调
1. 再次理解场景{anlian_text}中的人物,机构,事件行为,确保在描述节点时使用场景中本身的名称,为了与场景描述更接近,不要使用通用名称替换
2. 不要遗漏节点或行为
3. 每一条边必须连接两个节点,每个节点必须有名称,并且这个名称来自于场景,不能自行命名
4. 最终生成的图片中不要有重复的节点,如果有,则将重复的节点合并为1个节点
5. 确定整理的流程后,合理排版,再生成图片

"""

url,img_path = chat.glm_image(prompt=prompt,
                              models=["cogview-3","glm-image", ],
                              outdir="",size="1024x1024",)

print("img_path:",img_path)

```
|
|
|
|
|
|
|
|
|
|
|
|
|
|
graphviz
```
#!/usr/bin/env python3
"""
Graphviz 流程图绘制示例
用于生成贷款诈骗洗钱案的流程图
"""
import os
from graphviz import Digraph
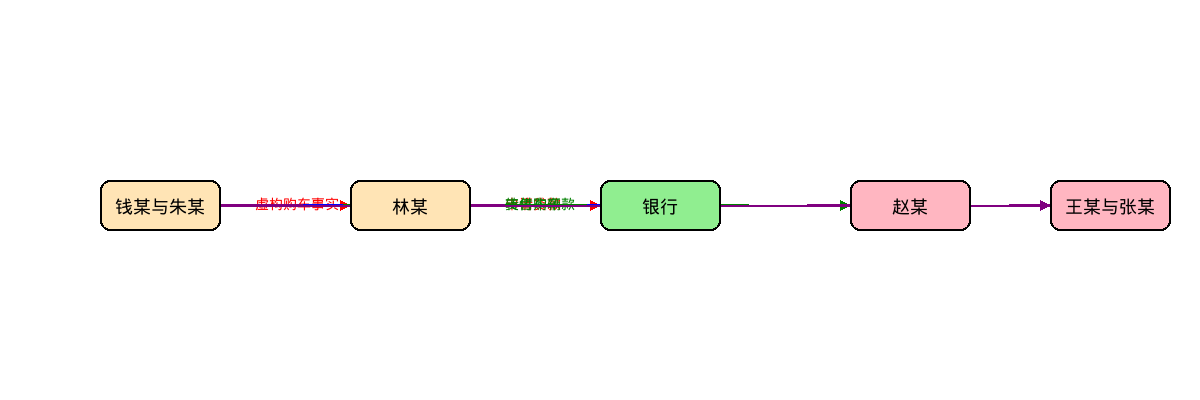
def create_flowchart_basic():
"""创建基础的流程图"""
print("=" * 60)
print("示例1: 基础流程图")
print("=" * 60)
# 创建有向图
dot = Digraph(comment='贷款诈骗洗钱案流程图')
# 设置图形属性
dot.attr(rankdir='LR') # 左到右布局
dot.attr('node', shape='box', style='rounded', fontname='WenQuanYi Micro Hei')
dot.attr('edge', fontname='WenQuanYi Micro Hei')
# 添加节点
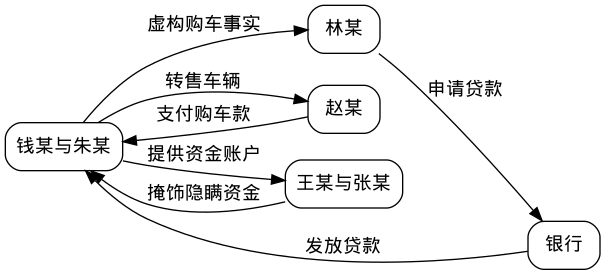
dot.node('A', '钱某与朱某')
dot.node('B', '林某')
dot.node('C', '银行')
dot.node('D', '赵某')
dot.node('E', '王某与张某')
# 添加边(连线)
dot.edge('A', 'B', label='虚构购车事实')
dot.edge('B', 'C', label='申请贷款')
dot.edge('C', 'A', label='发放贷款')
dot.edge('A', 'D', label='转售车辆')
dot.edge('D', 'A', label='支付购车款')
dot.edge('A', 'E', label='提供资金账户')
dot.edge('E', 'A', label='掩饰隐瞒资金')
# 保存为文件
output_file = 'flowchart_basic'
dot.render(output_file, format='png', cleanup=True)
print(f"✓ 基础流程图已保存: {output_file}.png")
return dot
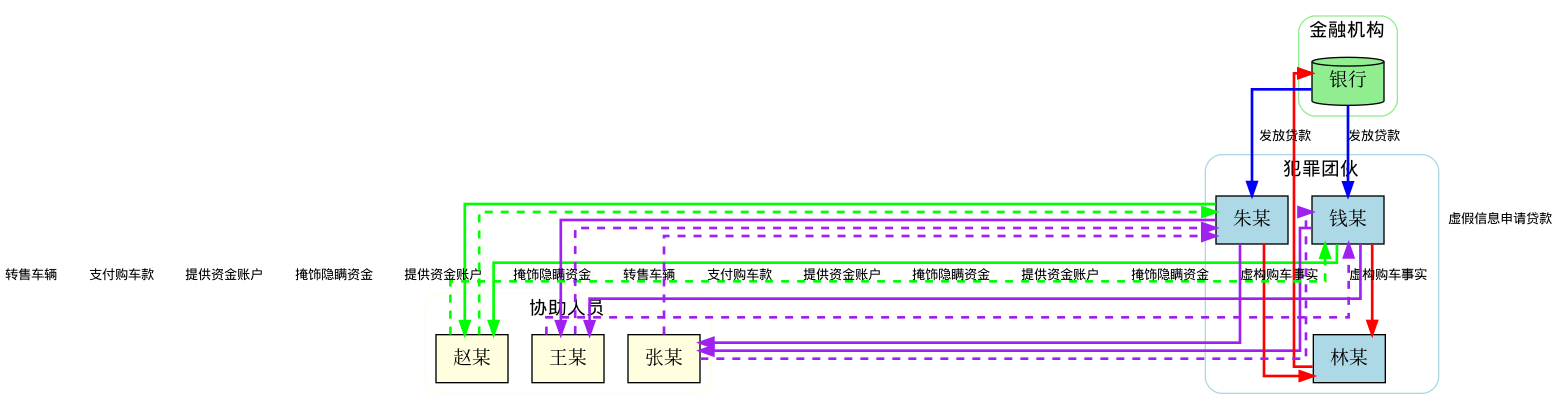
def create_flowchart_styled():
"""创建带样式的高级流程图"""
print("\n" + "=" * 60)
print("示例2: 带样式的流程图")
print("=" * 60)
dot = Digraph(comment='贷款诈骗洗钱案详细流程图')
# 设置全局属性
dot.attr(rankdir='TB', # 上到下布局
splines='ortho', # 正交线
fontname='WenQuanYi Micro Hei')
# 定义节点样式
with dot.subgraph(name='cluster_0') as c:
c.attr(label='犯罪团伙', style='rounded', color='lightblue')
c.attr('node', shape='box', style='filled', fillcolor='lightblue')
c.node('钱某', '钱某')
c.node('朱某', '朱某')
c.node('林某', '林某')
with dot.subgraph(name='cluster_1') as c:
c.attr(label='金融机构', style='rounded', color='lightgreen')
c.attr('node', shape='cylinder', style='filled', fillcolor='lightgreen')
c.node('银行', '银行')
with dot.subgraph(name='cluster_2') as c:
c.attr(label='协助人员', style='rounded', color='lightyellow')
c.attr('node', shape='box', style='filled', fillcolor='lightyellow')
c.node('赵某', '赵某')
c.node('王某', '王某')
c.node('张某', '张某')
# 添加边,使用不同颜色表示不同类型的行为
dot.attr('edge', fontname='WenQuanYi Micro Hei', fontsize='10')
# 虚假贷款流程(红色)
dot.edge('钱某', '林某', label='虚构购车事实', color='red', penwidth='2.0')
dot.edge('朱某', '林某', label='虚构购车事实', color='red', penwidth='2.0')
dot.edge('林某', '银行', label='虚假信息申请贷款', color='red', penwidth='2.0')
# 资金流转流程(蓝色)
dot.edge('银行', '钱某', label='发放贷款', color='blue', penwidth='2.0')
dot.edge('银行', '朱某', label='发放贷款', color='blue', penwidth='2.0')
# 转售流程(绿色)
dot.edge('钱某', '赵某', label='转售车辆', color='green', penwidth='2.0')
dot.edge('朱某', '赵某', label='转售车辆', color='green', penwidth='2.0')
dot.edge('赵某', '钱某', label='支付购车款', color='green', penwidth='2.0', style='dashed')
dot.edge('赵某', '朱某', label='支付购车款', color='green', penwidth='2.0', style='dashed')
# 洗钱流程(紫色)
dot.edge('钱某', '王某', label='提供资金账户', color='purple', penwidth='2.0')
dot.edge('钱某', '张某', label='提供资金账户', color='purple', penwidth='2.0')
dot.edge('朱某', '王某', label='提供资金账户', color='purple', penwidth='2.0')
dot.edge('朱某', '张某', label='提供资金账户', color='purple', penwidth='2.0')
dot.edge('王某', '钱某', label='掩饰隐瞒资金', color='purple', penwidth='2.0', style='dashed')
dot.edge('王某', '朱某', label='掩饰隐瞒资金', color='purple', penwidth='2.0', style='dashed')
dot.edge('张某', '钱某', label='掩饰隐瞒资金', color='purple', penwidth='2.0', style='dashed')
dot.edge('张某', '朱某', label='掩饰隐瞒资金', color='purple', penwidth='2.0', style='dashed')
# 保存文件
output_file = 'flowchart_styled'
dot.render(output_file, format='png', cleanup=True)
print(f"✓ 样式流程图已保存: {output_file}.png")
return dot
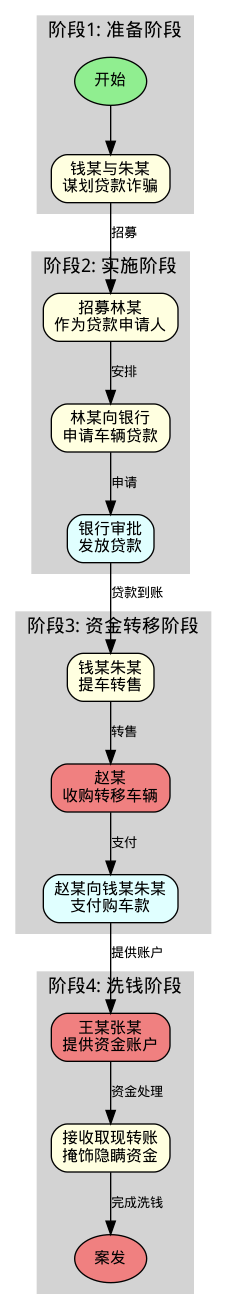
def create_flowchart_with_subgraphs():
"""创建带子图的复杂流程图"""
print("\n" + "=" * 60)
print("示例3: 带时间线的流程图")
print("=" * 60)
dot = Digraph(comment='贷款诈骗洗钱案时间线')
# 设置图形属性
dot.attr(rankdir='LR', fontname='WenQuanYi Micro Hei')
dot.attr('node', shape='box', style='rounded,filled', fontname='WenQuanYi Micro Hei')
dot.attr('edge', fontname='WenQuanYi Micro Hei')
# 阶段1:准备阶段
with dot.subgraph(name='cluster_0') as c:
c.attr(label='阶段1: 准备阶段', style='filled', color='lightgray')
c.node('start', '开始', shape='ellipse', fillcolor='lightgreen')
c.node('plan', '钱某与朱某\n谋划贷款诈骗', fillcolor='lightyellow')
c.edge('start', 'plan')
# 阶段2:实施阶段
with dot.subgraph(name='cluster_1') as c:
c.attr(label='阶段2: 实施阶段', style='filled', color='lightgray')
c.node('recruit', '招募林某\n作为贷款申请人', fillcolor='lightyellow')
c.node('apply', '林某向银行\n申请车辆贷款', fillcolor='lightyellow')
c.node('approve', '银行审批\n发放贷款', fillcolor='lightcyan')
c.edge('plan', 'recruit', label='招募')
c.edge('recruit', 'apply', label='安排')
c.edge('apply', 'approve', label='申请')
# 阶段3:转移阶段
with dot.subgraph(name='cluster_2') as c:
c.attr(label='阶段3: 资金转移阶段', style='filled', color='lightgray')
c.node('transfer', '钱某朱某\n提车转售', fillcolor='lightyellow')
c.node('zhao', '赵某\n收购转移车辆', fillcolor='lightcoral')
c.node('money_back', '赵某向钱某朱某\n支付购车款', fillcolor='lightcyan')
c.edge('approve', 'transfer', label='贷款到账')
c.edge('transfer', 'zhao', label='转售')
c.edge('zhao', 'money_back', label='支付')
# 阶段4:洗钱阶段
with dot.subgraph(name='cluster_3') as c:
c.attr(label='阶段4: 洗钱阶段', style='filled', color='lightgray')
c.node('wang_zhang', '王某张某\n提供资金账户', fillcolor='lightcoral')
c.node('launder', '接收取现转账\n掩饰隐瞒资金', fillcolor='lightyellow')
c.node('end', '案发', shape='ellipse', fillcolor='lightcoral')
c.edge('money_back', 'wang_zhang', label='提供账户')
c.edge('wang_zhang', 'launder', label='资金处理')
c.edge('launder', 'end', label='完成洗钱')
# 保存文件
output_file = 'flowchart_timeline'
dot.render(output_file, format='png', cleanup=True)
print(f"✓ 时间线流程图已保存: {output_file}.png")
return dot
def create_flowchart2():
"""创建带子图的复杂流程图(从上到下布局)"""
print("\n" + "=" * 60)
print("示例3: 带时间线的流程图(从上到下)")
print("=" * 60)
dot = Digraph(comment='贷款诈骗洗钱案时间线')
# 设置图形属性 - 从上到下布局
dot.attr(rankdir='TB', fontname='WenQuanYi Micro Hei')
dot.attr('node', shape='box', style='rounded,filled', fontname='WenQuanYi Micro Hei', fontsize='12')
dot.attr('edge', fontname='WenQuanYi Micro Hei', fontsize='10')
# 阶段1:准备阶段
with dot.subgraph(name='cluster_0') as c:
c.attr(label='阶段1: 准备阶段', style='filled', color='lightgray')
c.node('start', '开始', shape='ellipse', fillcolor='lightgreen')
c.node('plan', '钱某与朱某\n谋划贷款诈骗', fillcolor='lightyellow')
c.edge('start', 'plan')
# 阶段2:实施阶段
with dot.subgraph(name='cluster_1') as c:
c.attr(label='阶段2: 实施阶段', style='filled', color='lightgray')
c.node('recruit', '招募林某\n作为贷款申请人', fillcolor='lightyellow')
c.node('apply', '林某向银行\n申请车辆贷款', fillcolor='lightyellow')
c.node('approve', '银行审批\n发放贷款', fillcolor='lightcyan')
c.edge('plan', 'recruit', label='招募')
c.edge('recruit', 'apply', label='安排')
c.edge('apply', 'approve', label='申请')
# 阶段3:转移阶段
with dot.subgraph(name='cluster_2') as c:
c.attr(label='阶段3: 资金转移阶段', style='filled', color='lightgray')
c.node('transfer', '钱某朱某\n提车转售', fillcolor='lightyellow')
c.node('zhao', '赵某\n收购转移车辆', fillcolor='lightcoral')
c.node('money_back', '赵某向钱某朱某\n支付购车款', fillcolor='lightcyan')
c.edge('approve', 'transfer', label='贷款到账')
c.edge('transfer', 'zhao', label='转售')
c.edge('zhao', 'money_back', label='支付')
# 阶段4:洗钱阶段
with dot.subgraph(name='cluster_3') as c:
c.attr(label='阶段4: 洗钱阶段', style='filled', color='lightgray')
c.node('wang_zhang', '王某张某\n提供资金账户', fillcolor='lightcoral')
c.node('launder', '接收取现转账\n掩饰隐瞒资金', fillcolor='lightyellow')
c.node('end', '案发', shape='ellipse', fillcolor='lightcoral')
c.edge('money_back', 'wang_zhang', label='提供账户')
c.edge('wang_zhang', 'launder', label='资金处理')
c.edge('launder', 'end', label='完成洗钱')
# 保存文件
output_file = 'flowchart_timeline'
dot.render(output_file, format='png', cleanup=True)
print(f"✓ 时间线流程图已保存: {output_file}.png")
return dot
def create_simple_decision_flow():
"""创建简单的决策流程图"""
print("\n" + "=" * 60)
print("示例4: 决策流程图")
print("=" * 60)
dot = Digraph(comment='贷款审批决策流程')
# 设置图形属性
dot.attr(rankdir='TB', fontname='WenQuanYi Micro Hei')
dot.attr('node', fontname='WenQuanYi Micro Hei')
dot.attr('edge', fontname='WenQuanYi Micro Hei')
# 添加节点
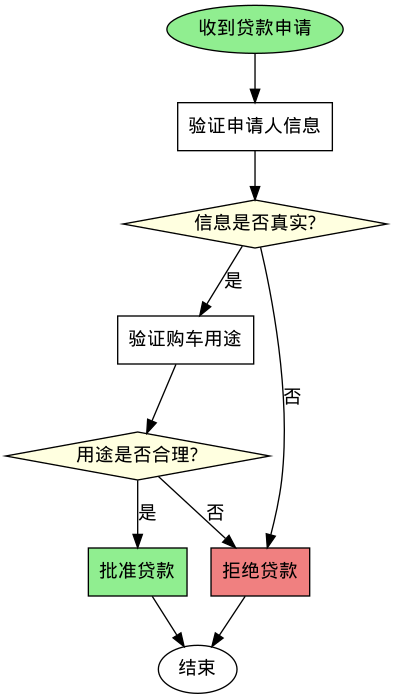
dot.node('start', '收到贷款申请', shape='ellipse', style='filled', fillcolor='lightgreen')
dot.node('check1', '验证申请人信息', shape='box')
dot.node('decision1', '信息是否真实?', shape='diamond', style='filled', fillcolor='lightyellow')
dot.node('check2', '验证购车用途', shape='box')
dot.node('decision2', '用途是否合理?', shape='diamond', style='filled', fillcolor='lightyellow')
dot.node('approve', '批准贷款', shape='box', style='filled', fillcolor='lightgreen')
dot.node('reject', '拒绝贷款', shape='box', style='filled', fillcolor='lightcoral')
dot.node('end', '结束', shape='ellipse')
# 添加边
dot.edge('start', 'check1')
dot.edge('check1', 'decision1')
dot.edge('decision1', 'check2', label='是')
dot.edge('decision1', 'reject', label='否')
dot.edge('check2', 'decision2')
dot.edge('decision2', 'approve', label='是')
dot.edge('decision2', 'reject', label='否')
dot.edge('approve', 'end')
dot.edge('reject', 'end')
# 保存文件
output_file = 'flowchart_decision'
dot.render(output_file, format='png', cleanup=True)
print(f"✓ 决策流程图已保存: {output_file}.png")
return dot
def main():
"""主函数:生成所有示例流程图"""
print("\n" + "=" * 60)
print("Graphviz 流程图绘制示例")
print("=" * 60)
print(f"当前工作目录: {os.getcwd()}")
print(f"输出目录: {os.path.abspath('.')}")
try:
# 创建所有示例
create_flowchart_basic()
create_flowchart_styled()
# create_flowchart_with_subgraphs()
create_simple_decision_flow()
create_flowchart2()
print("\n" + "=" * 60)
print("✓ 所有流程图生成完成!")
print("=" * 60)
# 列出生成的文件
print("\n生成的文件:")
for f in ['flowchart_basic.png', 'flowchart_styled.png',
'flowchart_timeline.png', 'flowchart_decision.png']:
if os.path.exists(f):
size = os.path.getsize(f) / 1024
print(f" ✓ {f} ({size:.2f} KB)")
else:
print(f" ✗ {f} (未生成)")
except Exception as e:
print(f"\n✗ 错误: {e}")
print("请确保已安装 graphviz:")
print(" pip install graphviz")
print(" sudo apt-get install graphviz")
if __name__ == "__main__":
main()
```
|
|
|
|
|
|
|
|
|
|
|
|
|
|
pillow
```
#!/usr/bin/env python3
"""
Pillow 流程图绘制示例
用于生成贷款诈骗洗钱案的流程图
使用 PIL/Pillow 库直接绘制,不依赖 graphviz
"""
from PIL import Image, ImageDraw, ImageFont
import os
# 尝试加载中文字体
def get_chinese_font(size=20):
"""获取中文字体"""
font_paths = [
'/usr/share/fonts/truetype/wqy/wqy-microhei.ttc', # 文泉驿微米黑
'/usr/share/fonts/truetype/wqy/wqy-zenhei.ttc', # 文泉驿正黑
'/usr/share/fonts/truetype/noto/NotoSansCJK-Regular.ttc', # 思源黑体
'/usr/share/fonts/truetype/dejavu/DejaVuSans.ttf', # 默认字体
]
for font_path in font_paths:
if os.path.exists(font_path):
try:
return ImageFont.truetype(font_path, size)
except:
continue
# 如果都失败了,使用默认字体
return ImageFont.load_default()
def create_flowchart_basic():
"""创建基础的流程图"""
print("=" * 60)
print("示例1: 基础流程图(横向布局)")
print("=" * 60)
# 图片尺寸
width, height = 1200, 400
# 创建白色背景图片
img = Image.new('RGB', (width, height), color='white')
draw = ImageDraw.Draw(img)
# 字体
title_font = get_chinese_font(24)
text_font = get_chinese_font(18)
label_font = get_chinese_font(14)
# 节点配置
nodes = {
'A': {'text': '钱某与朱某', 'x': 100, 'y': 180, 'color': '#FFE4B5'},
'B': {'text': '林某', 'x': 350, 'y': 180, 'color': '#FFE4B5'},
'C': {'text': '银行', 'x': 600, 'y': 180, 'color': '#90EE90'},
'D': {'text': '赵某', 'x': 850, 'y': 180, 'color': '#FFB6C1'},
'E': {'text': '王某与张某', 'x': 1050, 'y': 180, 'color': '#FFB6C1'},
}
# 边(连线)配置
edges = [
{'from': 'A', 'to': 'B', 'label': '虚构购车事实', 'color': 'red'},
{'from': 'B', 'to': 'C', 'label': '申请贷款', 'color': 'red'},
{'from': 'C', 'to': 'A', 'label': '发放贷款', 'color': 'blue'},
{'from': 'A', 'to': 'D', 'label': '转售车辆', 'color': 'green'},
{'from': 'D', 'to': 'A', 'label': '支付购车款', 'color': 'green', 'dashed': True},
{'from': 'A', 'to': 'E', 'label': '提供资金账户', 'color': 'purple'},
{'from': 'E', 'to': 'A', 'label': '掩饰隐瞒资金', 'color': 'purple', 'dashed': True},
]
# 绘制箭头辅助函数
def draw_arrow(x1, y1, x2, y2, color='black', dashed=False):
"""绘制带箭头的线"""
# 线的样式
if dashed:
# 虚线
for i in range(0, 10, 2):
start = i / 10
end = (i + 1) / 10
draw.line([
(x1 + (x2 - x1) * start, y1 + (y2 - y1) * start),
(x1 + (x2 - x1) * end, y1 + (y2 - y1) * end)
], fill=color, width=2)
else:
# 实线
draw.line([(x1, y1), (x2, y2)], fill=color, width=2)
# 箭头
arrow_size = 10
angle = 0.5 # 箭头角度
# 计算箭头方向
dx = x2 - x1
dy = y2 - y1
length = (dx**2 + dy**2)**0.5
if length > 0:
dx /= length
dy /= length
# 箭头的两个点
ax1 = x2 - arrow_size * (dx + angle * dy)
ay1 = y2 - arrow_size * (dy - angle * dx)
ax2 = x2 - arrow_size * (dx - angle * dy)
ay2 = y2 - arrow_size * (dy + angle * dx)
draw.polygon([(x2, y2), (ax1, ay1), (ax2, ay2)], fill=color)
# 先绘制所有的连线
for edge in edges:
node_from = nodes[edge['from']]
node_to = nodes[edge['to']]
# 计算连线的起点和终点(节点边缘)
x1 = node_from['x'] + 60 # 节点宽度的一半
y1 = node_from['y'] + 25 # 节点高度的一半
x2 = node_to['x']
y2 = node_to['y'] + 25
draw_arrow(x1, y1, x2, y2, color=edge['color'], dashed=edge.get('dashed', False))
# 绘制标签
mid_x = (x1 + x2) // 2
mid_y = (y1 + y2) // 2 - 10
draw.text((mid_x, mid_y), edge['label'], fill=edge['color'], font=label_font)
# 绘制节点
for node_id, node in nodes.items():
x, y = node['x'], node['y']
w, h = 120, 50 # 节点宽度和高度
# 绘制圆角矩形
draw.rounded_rectangle(
[(x, y), (x + w, y + h)],
radius=10,
fill=node['color'],
outline='black',
width=2
)
# 绘制文本
text = node['text']
bbox = draw.textbbox((0, 0), text, font=text_font)
text_width = bbox[2] - bbox[0]
text_height = bbox[3] - bbox[1]
text_x = x + (w - text_width) // 2
text_y = y + (h - text_height) // 2
draw.text((text_x, text_y), text, fill='black', font=text_font)
# 保存图片
output_file = 'pillow_flowchart_basic.png'
img.save(output_file)
print(f"✓ 基础流程图已保存: {output_file}")
return img
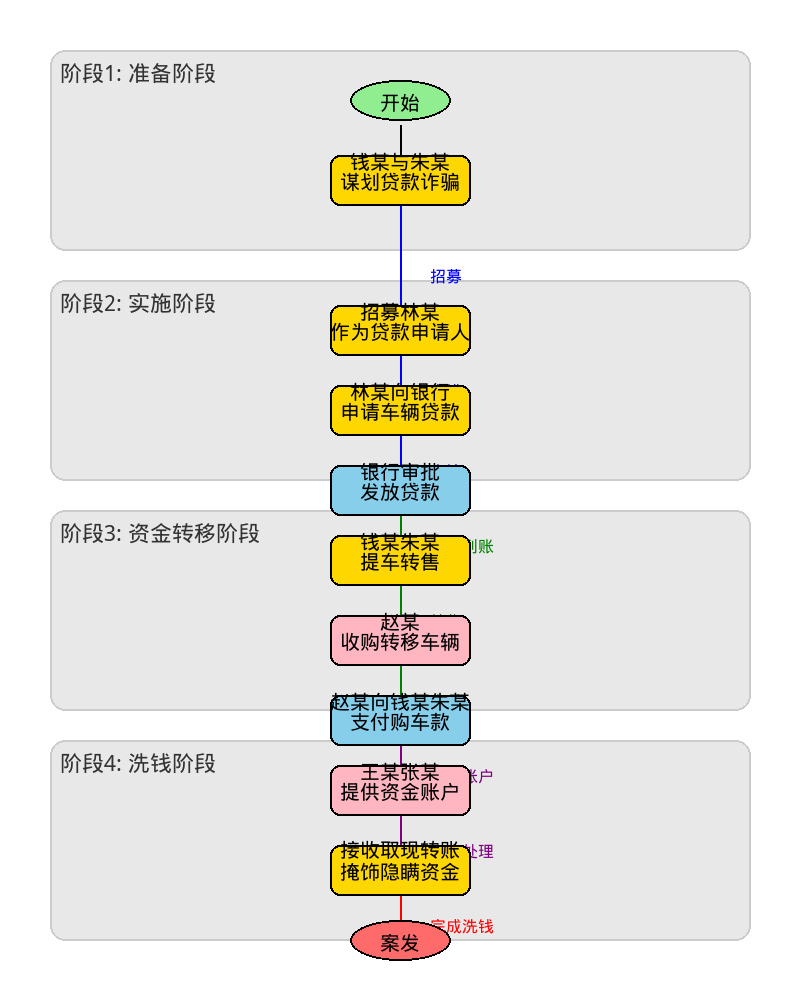
def create_flowchart_vertical():
"""创建纵向流程图(从上到下)"""
print("\n" + "=" * 60)
print("示例2: 纵向流程图(从上到下)")
print("=" * 60)
# 图片尺寸
width, height = 800, 1000
# 创建白色背景图片
img = Image.new('RGB', (width, height), color='white')
draw = ImageDraw.Draw(img)
# 字体
title_font = get_chinese_font(28)
text_font = get_chinese_font(20)
label_font = get_chinese_font(16)
phase_font = get_chinese_font(22)
# 阶段标题
phases = [
{'text': '阶段1: 准备阶段', 'y': 50, 'color': '#E8E8E8'},
{'text': '阶段2: 实施阶段', 'y': 280, 'color': '#E8E8E8'},
{'text': '阶段3: 资金转移阶段', 'y': 510, 'color': '#E8E8E8'},
{'text': '阶段4: 洗钱阶段', 'y': 740, 'color': '#E8E8E8'},
]
# 绘制阶段背景
for phase in phases:
draw.rounded_rectangle(
[(50, phase['y']), (width - 50, phase['y'] + 200)],
radius=15,
fill=phase['color'],
outline='#CCCCCC',
width=2
)
draw.text((60, phase['y'] + 10), phase['text'], fill='#333333', font=phase_font)
# 节点配置
nodes = {
'start': {'text': '开始', 'x': 400, 'y': 100, 'shape': 'ellipse', 'color': '#90EE90'},
'plan': {'text': '钱某与朱某\n谋划贷款诈骗', 'x': 400, 'y': 180, 'color': '#FFD700'},
'recruit': {'text': '招募林某\n作为贷款申请人', 'x': 400, 'y': 330, 'color': '#FFD700'},
'apply': {'text': '林某向银行\n申请车辆贷款', 'x': 400, 'y': 410, 'color': '#FFD700'},
'approve': {'text': '银行审批\n发放贷款', 'x': 400, 'y': 490, 'color': '#87CEEB'},
'transfer': {'text': '钱某朱某\n提车转售', 'x': 400, 'y': 560, 'color': '#FFD700'},
'zhao': {'text': '赵某\n收购转移车辆', 'x': 400, 'y': 640, 'color': '#FFB6C1'},
'money': {'text': '赵某向钱某朱某\n支付购车款', 'x': 400, 'y': 720, 'color': '#87CEEB'},
'wang': {'text': '王某张某\n提供资金账户', 'x': 400, 'y': 790, 'color': '#FFB6C1'},
'launder': {'text': '接收取现转账\n掩饰隐瞒资金', 'x': 400, 'y': 870, 'color': '#FFD700'},
'end': {'text': '案发', 'x': 400, 'y': 940, 'shape': 'ellipse', 'color': '#FF6B6B'},
}
# 边(连线)配置
edges = [
{'from': 'start', 'to': 'plan', 'label': '', 'color': 'black'},
{'from': 'plan', 'to': 'recruit', 'label': '招募', 'color': 'blue'},
{'from': 'recruit', 'to': 'apply', 'label': '安排', 'color': 'blue'},
{'from': 'apply', 'to': 'approve', 'label': '申请', 'color': 'blue'},
{'from': 'approve', 'to': 'transfer', 'label': '贷款到账', 'color': 'green'},
{'from': 'transfer', 'to': 'zhao', 'label': '转售', 'color': 'green'},
{'from': 'zhao', 'to': 'money', 'label': '支付', 'color': 'green'},
{'from': 'money', 'to': 'wang', 'label': '提供账户', 'color': 'purple'},
{'from': 'wang', 'to': 'launder', 'label': '资金处理', 'color': 'purple'},
{'from': 'launder', 'to': 'end', 'label': '完成洗钱', 'color': 'red'},
]
# 绘制箭头辅助函数
def draw_arrow_vertical(x1, y1, x2, y2, color='black', dashed=False):
"""绘制纵向箭头"""
# 线的样式
if dashed:
for i in range(0, 10, 2):
start = i / 10
end = (i + 1) / 10
draw.line([
(x1 + (x2 - x1) * start, y1 + (y2 - y1) * start),
(x1 + (x2 - x1) * end, y1 + (y2 - y1) * end)
], fill=color, width=2)
else:
draw.line([(x1, y1), (x2, y2)], fill=color, width=2)
# 箭头
arrow_size = 10
dx = x2 - x1
dy = y2 - y1
length = (dx**2 + dy**2)**0.5
if length > 0:
dx /= length
dy /= length
# 箭头的两个点
angle = 0.4
ax1 = x2 - arrow_size * (dx + angle * dy)
ay1 = y2 - arrow_size * (dy - angle * dx)
ax2 = x2 - arrow_size * (dx - angle * dy)
ay2 = y2 - arrow_size * (dy + angle * dx)
draw.polygon([(x2, y2), (ax1, ay1), (ax2, ay2)], fill=color)
# 先绘制所有的连线
for edge in edges:
node_from = nodes[edge['from']]
node_to = nodes[edge['to']]
# 计算连线的起点和终点(节点边缘)
x1 = node_from['x']
y1 = node_from['y'] + 25 # 节点底部
x2 = node_to['x']
y2 = node_to['y'] # 节点顶部
draw_arrow_vertical(x1, y1, x2, y2, color=edge['color'], dashed=edge.get('dashed', False))
# 绘制标签(如果有)
if edge['label']:
mid_x = (x1 + x2) // 2 + 30
mid_y = (y1 + y2) // 2
draw.text((mid_x, mid_y), edge['label'], fill=edge['color'], font=label_font)
# 绘制节点
for node_id, node in nodes.items():
x, y = node['x'], node['y']
text = node['text']
color = node['color']
shape = node.get('shape', 'rectangle')
if shape == 'ellipse':
# 椭圆形节点(开始/结束)
w, h = 100, 40
draw.ellipse(
[(x - w//2, y - h//2), (x + w//2, y + h//2)],
fill=color,
outline='black',
width=2
)
else:
# 矩形节点
w, h = 140, 50
draw.rounded_rectangle(
[(x - w//2, y - h//2), (x + w//2, y + h//2)],
radius=10,
fill=color,
outline='black',
width=2
)
# 绘制文本(支持多行)
lines = text.split('\n')
for i, line in enumerate(lines):
bbox = draw.textbbox((0, 0), line, font=text_font)
text_width = bbox[2] - bbox[0]
text_height = bbox[3] - bbox[1]
text_x = x - text_width // 2
text_y = y - text_height // 2 + (i - len(lines)//2) * (text_height + 2)
draw.text((text_x, text_y), line, fill='black', font=text_font)
# 保存图片
output_file = 'pillow_flowchart_vertical.png'
img.save(output_file)
print(f"✓ 纵向流程图已保存: {output_file}")
return img
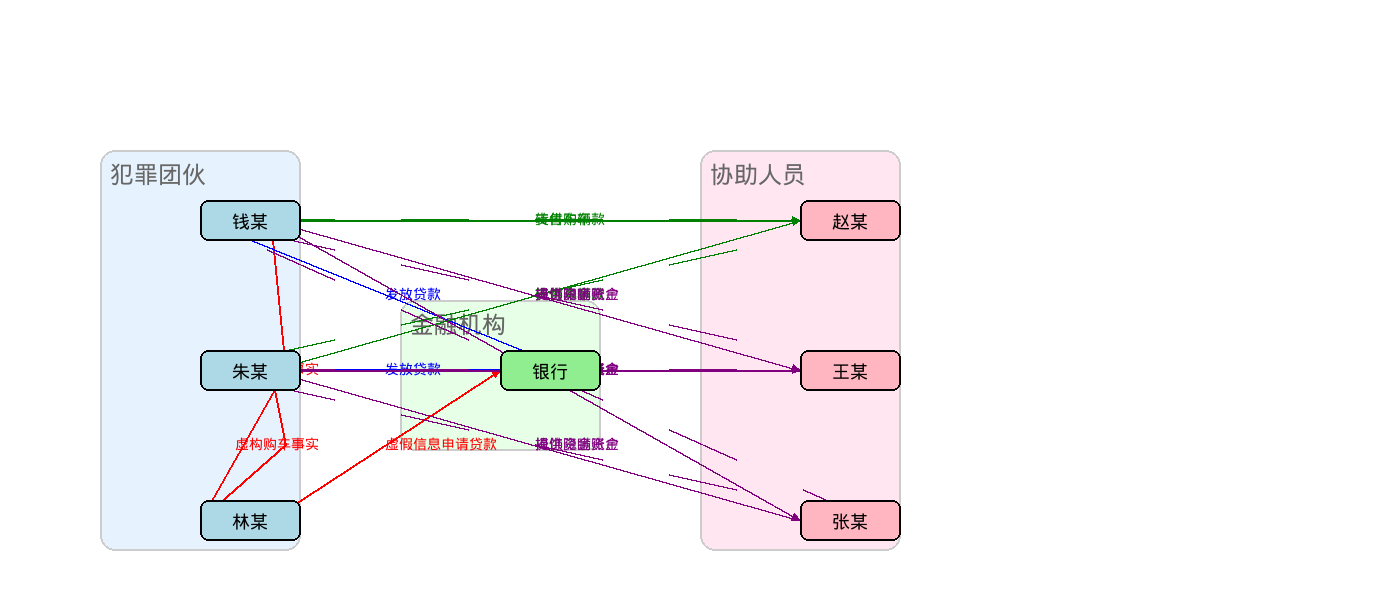
def create_flowchart_complex():
"""创建复杂的多色流程图"""
print("\n" + "=" * 60)
print("示例3: 复杂多色流程图(横向布局)")
print("=" * 60)
# 图片尺寸
width, height = 1400, 600
# 创建白色背景图片
img = Image.new('RGB', (width, height), color='white')
draw = ImageDraw.Draw(img)
# 字体
title_font = get_chinese_font(24)
text_font = get_chinese_font(18)
label_font = get_chinese_font(14)
# 定义节点组(按角色分组)
groups = {
'criminals': {
'label': '犯罪团伙',
'nodes': {
'钱某': {'x': 200, 'y': 200, 'color': '#ADD8E6'},
'朱某': {'x': 200, 'y': 350, 'color': '#ADD8E6'},
'林某': {'x': 200, 'y': 500, 'color': '#ADD8E6'},
}
},
'bank': {
'label': '金融机构',
'nodes': {
'银行': {'x': 500, 'y': 350, 'color': '#90EE90'},
}
},
'helpers': {
'label': '协助人员',
'nodes': {
'赵某': {'x': 800, 'y': 200, 'color': '#FFB6C1'},
'王某': {'x': 800, 'y': 350, 'color': '#FFB6C1'},
'张某': {'x': 800, 'y': 500, 'color': '#FFB6C1'},
}
},
}
# 边(连线)配置 - 使用不同颜色表示不同类型的行为
edges = [
# 虚假贷款流程(红色)
{'from': ('钱某', 'criminals'), 'to': ('林某', 'criminals'), 'label': '虚构购车事实', 'color': 'red'},
{'from': ('朱某', 'criminals'), 'to': ('林某', 'criminals'), 'label': '虚构购车事实', 'color': 'red'},
{'from': ('林某', 'criminals'), 'to': ('银行', 'bank'), 'label': '虚假信息申请贷款', 'color': 'red'},
# 资金流转流程(蓝色)
{'from': ('银行', 'bank'), 'to': ('钱某', 'criminals'), 'label': '发放贷款', 'color': 'blue'},
{'from': ('银行', 'bank'), 'to': ('朱某', 'criminals'), 'label': '发放贷款', 'color': 'blue'},
# 转售流程(绿色)
{'from': ('钱某', 'criminals'), 'to': ('赵某', 'helpers'), 'label': '转售车辆', 'color': 'green'},
{'from': ('朱某', 'criminals'), 'to': ('赵某', 'helpers'), 'label': '转售车辆', 'color': 'green'},
{'from': ('赵某', 'helpers'), 'to': ('钱某', 'criminals'), 'label': '支付购车款', 'color': 'green', 'dashed': True},
{'from': ('赵某', 'helpers'), 'to': ('朱某', 'criminals'), 'label': '支付购车款', 'color': 'green', 'dashed': True},
# 洗钱流程(紫色)
{'from': ('钱某', 'criminals'), 'to': ('王某', 'helpers'), 'label': '提供资金账户', 'color': 'purple'},
{'from': ('钱某', 'criminals'), 'to': ('张某', 'helpers'), 'label': '提供资金账户', 'color': 'purple'},
{'from': ('朱某', 'criminals'), 'to': ('王某', 'helpers'), 'label': '提供资金账户', 'color': 'purple'},
{'from': ('朱某', 'criminals'), 'to': ('张某', 'helpers'), 'label': '提供资金账户', 'color': 'purple'},
{'from': ('王某', 'helpers'), 'to': ('钱某', 'criminals'), 'label': '掩饰隐瞒资金', 'color': 'purple', 'dashed': True},
{'from': ('王某', 'helpers'), 'to': ('朱某', 'criminals'), 'label': '掩饰隐瞒资金', 'color': 'purple', 'dashed': True},
{'from': ('张某', 'helpers'), 'to': ('钱某', 'criminals'), 'label': '掩饰隐瞒资金', 'color': 'purple', 'dashed': True},
{'from': ('张某', 'helpers'), 'to': ('朱某', 'criminals'), 'label': '掩饰隐瞒资金', 'color': 'purple', 'dashed': True},
]
# 绘制分组背景
group_boxes = {
'criminals': {'x': 100, 'y': 150, 'w': 200, 'h': 400, 'color': '#E6F3FF'},
'bank': {'x': 400, 'y': 300, 'w': 200, 'h': 150, 'color': '#E6FFE6'},
'helpers': {'x': 700, 'y': 150, 'w': 200, 'h': 400, 'color': '#FFE6F0'},
}
for group_id, box in group_boxes.items():
# 绘制分组背景
draw.rounded_rectangle(
[(box['x'], box['y']), (box['x'] + box['w'], box['y'] + box['h'])],
radius=15,
fill=box['color'],
outline='#CCCCCC',
width=2
)
# 绘制分组标签
group_label = groups[group_id]['label']
draw.text((box['x'] + 10, box['y'] + 10), group_label, fill='#666666', font=title_font)
# 绘制箭头辅助函数
def draw_arrow_curved(x1, y1, x2, y2, color='black', dashed=False, curve_offset=0):
"""绘制箭头(支持弯曲)"""
if curve_offset == 0:
# 直线
if dashed:
for i in range(0, 10, 2):
start = i / 10
end = (i + 1) / 10
draw.line([
(x1 + (x2 - x1) * start, y1 + (y2 - y1) * start),
(x1 + (x2 - x1) * end, y1 + (y2 - y1) * end)
], fill=color, width=2)
else:
draw.line([(x1, y1), (x2, y2)], fill=color, width=2)
else:
# 贝塞尔曲线(简化为两段直线)
mid_x = (x1 + x2) // 2 + curve_offset
mid_y = (y1 + y2) // 2
if dashed:
for i in range(0, 20, 2):
start = i / 20
end = (i + 1) / 20
# 第一段
t1 = min(end, 0.5)
t2 = min(start, 0.5)
if start < 0.5 and end > 0.5:
pass # 跳过中间点
elif start < 0.5:
px1 = x1 + (mid_x - x1) * t1
py1 = y1 + (mid_y - y1) * t1
px2 = x1 + (mid_x - x1) * t2
py2 = y1 + (mid_y - y1) * t2
draw.line([(px1, py1), (px2, py2)], fill=color, width=2)
else:
px1 = mid_x + (x2 - mid_x) * (t1 - 0.5) * 2
py1 = mid_y + (y2 - mid_y) * (t1 - 0.5) * 2
px2 = mid_x + (x2 - mid_x) * (t2 - 0.5) * 2
py2 = mid_y + (y2 - mid_y) * (t2 - 0.5) * 2
draw.line([(px1, py1), (px2, py2)], fill=color, width=2)
else:
draw.line([(x1, y1), (mid_x, mid_y)], fill=color, width=2)
draw.line([(mid_x, mid_y), (x2, y2)], fill=color, width=2)
# 绘制箭头
arrow_size = 8
dx = x2 - (mid_x if curve_offset != 0 else x1)
dy = y2 - (mid_y if curve_offset != 0 else y1)
length = (dx**2 + dy**2)**0.5
if length > 0:
dx /= length
dy /= length
angle = 0.4
ax1 = x2 - arrow_size * (dx + angle * dy)
ay1 = y2 - arrow_size * (dy - angle * dx)
ax2 = x2 - arrow_size * (dx - angle * dy)
ay2 = y2 - arrow_size * (dy + angle * dx)
draw.polygon([(x2, y2), (ax1, ay1), (ax2, ay2)], fill=color)
# 绘制所有连线
for edge in edges:
from_node, from_group = edge['from']
to_node, to_group = edge['to']
from_pos = groups[from_group]['nodes'][from_node]
to_pos = groups[to_group]['nodes'][to_node]
x1, y1 = from_pos['x'] + 70, from_pos['y'] + 20
x2, y2 = to_pos['x'], to_pos['y'] + 20
# 计算曲线偏移
curve_offset = 0
if from_group == to_group:
curve_offset = 50 if from_pos['y'] < to_pos['y'] else -50
draw_arrow_curved(x1, y1, x2, y2, color=edge['color'], dashed=edge.get('dashed', False), curve_offset=curve_offset)
# 绘制标签
mid_x = (x1 + x2) // 2
mid_y = (y1 + y2) // 2 - 10
draw.text((mid_x, mid_y), edge['label'], fill=edge['color'], font=label_font)
# 绘制节点
for group_id, group in groups.items():
for node_name, node in group['nodes'].items():
x, y = node['x'], node['y']
w, h = 100, 40
# 绘制圆角矩形
draw.rounded_rectangle(
[(x, y), (x + w, y + h)],
radius=8,
fill=node['color'],
outline='black',
width=2
)
# 绘制文本
bbox = draw.textbbox((0, 0), node_name, font=text_font)
text_width = bbox[2] - bbox[0]
text_height = bbox[3] - bbox[1]
text_x = x + (w - text_width) // 2
text_y = y + (h - text_height) // 2
draw.text((text_x, text_y), node_name, fill='black', font=text_font)
# 保存图片
output_file = 'pillow_flowchart_complex.png'
img.save(output_file)
print(f"✓ 复杂流程图已保存: {output_file}")
return img
def main():
"""主函数:生成所有示例流程图"""
print("\n" + "=" * 60)
print("Pillow 流程图绘制示例")
print("=" * 60)
print(f"当前工作目录: {os.getcwd()}")
print(f"输出目录: {os.path.abspath('.')}")
try:
# 创建所有示例
create_flowchart_basic()
create_flowchart_vertical()
create_flowchart_complex()
print("\n" + "=" * 60)
print("✓ 所有流程图生成完成!")
print("=" * 60)
# 列出生成的文件
print("\n生成的文件:")
files = [
'pillow_flowchart_basic.png',
'pillow_flowchart_vertical.png',
'pillow_flowchart_complex.png'
]
for f in files:
if os.path.exists(f):
size = os.path.getsize(f) / 1024
print(f" ✓ {f} ({size:.2f} KB)")
else:
print(f" ✗ {f} (未生成)")
except Exception as e:
print(f"\n✗ 错误: {e}")
import traceback
traceback.print_exc()
if __name__ == "__main__":
main()
```
|
|
|
|
|
|
|
|
|
|
|
|
|
|
参考